Segmentation & targeting in the Healthcare industry ı Why bother to segment and target your customers? It can be time-consuming, fraught with personality conflicts and may well annoy a section of customers who suddenly see their support drop. So, the question stands, why bother to do this? The answer is simple: effective targeting frees up resources.
What is the difference between profiling, segmentation & targeting?
Whilst the terms profiling, segmentation & targeting are often used fairly interchangeably, they are actually distinctive steps within a process. Profiling refers to the process of analysing your chosen customer group using some predefined parameters. Segmentation refers to the process of dividing your customer group according to their profiles and, finally, Targeting refers to the decision process whereby you choose on which customers you are going to concentrate certain resources.
Let’s look at each of these in turn.
1. Profiling
Profiling refers to the process of analysing your customer base in terms of selected criteria that you regard as being relevant to your business. Usually, this is a combination of the customers potential to use your product and the extent to which they actually use the brand. Other considerations might be the extent to which they are advocates of your brand or, simply, their accessibility with regards to your field force.

Once you have identified your required criteria, each customer is then evaluated in terms of the chosen parameters, in this case their potential to prescribe our product and the extent to which they have adopted the product as their preferred treatment option.
2. Segmentation
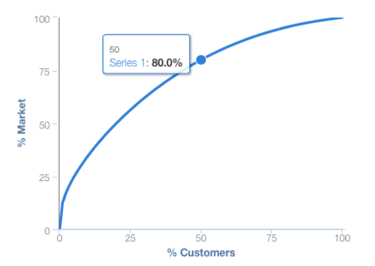
So, now that we have profiled our customers in terms of their potential and product adoption, how do we know into which segment they will fall? How do we define whether they an A, B or C potential customer? The short answer is that we use concentration curves.
To illustrate concentration curves, we need to take a step back in time to the turn of the 20th century and the works of an Italian economist called Vilfredo Pareto. Whilst at the University of Lausanne, he published a paper (his first, incidentally) that would form the basis for what would later be called The Pareto Principle, or The 80:20 Rule. In it he observed that the land ownership of Italy wasn’t evenly distributed, but was instead concentrated in a relatively small proportion of the population with 80% of the land being owned by only 20% of the population. This 80:20 ratio of land ownership is known as a concentration curve.

Within most markets in the pharmaceutical industry, we seldom see an 80:20 concentration curve but we do see lots of others. Actually, in most pharmaceutical markets we see an 80:50 split where 50% of the prescribers write 80% of the value of the market. To give you an indication of what this means in reality, the top 10% of prescribers in a market with an 80:50 concentration will prescribe 34.7% of the market potential whilst the lowest 10% will only prescribe around 2% of the market potential. So, whilst you have the same number of customers but two very different potentials to write your product.

The first segmentation element, the first vertical cut-off as it where, is therefore at 10% in this market. Putting it a different way, by only seeing the top 10% of customers, we have access to 34.7% of the business using very few resources (only those needed to call on the top 10% of customers).
We may, however, decide that only having access to 34.7% of the business using our sales team is not sufficient. We therefore need to add in some other segments to further divide up the potential. We know that 50% of the customers prescribe 80% of the business so it makes sense, budget and resources allowing, for us to see as many of the top 50% of customers as possible.

If we therefore set the second cut-off at 50%, we have access to 80% of the market whilst only requiring sufficient resources to see 50% of the customers. The remaining 50% of customers are then untargeted by the sales teams, becoming C-customers and targeted through other, less costly marketing channels.

Setting the vertical adoption cut-offs is often more difficult and open to subjectivity as you will very seldom have a complete understanding of exactly what amount of your product is being used by a specific doctor. In addition, the amount will be relative. What constitutes “a lot” for an orphan drug will be very different to that of an anti-hypertensive drug. It is important to use whatever information you have to hand to guide your thinking though – try to keep it as “scientific” and objective as possible.
In this example, being for a hypothetical product and market, I have chosen simply to set the vertical adoption cut-offs to: “Uses little or none of our product”, “Uses a moderate amount of our product”, and, “Uses mainly or only our product”. The lowest adoption is assigned a 3, moderate adoption a 2 and high adoption a 1.

We are now in the position to combine our potential and adoption rankings into our final segmentation.

Once we have plotted all of our customers using these criteria, we have then concluded our segmentation process and we are now able to move onto targeting.
One final word on segmentation though – please keep it as simple as possible. If you are not going to do something different in a segment, please don’t have the segment; it just serves to confuse things. One of our consultants once worked with a company that had segmented their market into 52 different segments – a completely unworkable system. Simpler is almost always better. In the case of our example, we are not going to call on the lowest 50% of prescribers, as they only are able to contribute 20% of the market. It therefore makes sense to combine the C segments into one untargeted group.

3. Targeting
Targeting involves selecting which of the segments you will plan to reach with different channels, such your field force as an example. Pharmaceutical representatives are an extremely expensive resource and generally, the more people you wish to target with your field force, the more sales reps you need. By targeting fewer customers, we are able to free up resources, requiring fewer sales reps to call on the reduced number of targeted doctors.
In this example, we may choose to stop our sales team calling on any of the C customers. In a market where you may have 32,000 general practitioners, this removes 16,000 prescribers from the list of prescribers on whom our sales team need to call, for the loss of only 20% of the market potential. This means that we can refocus resources on the A and B customers who actually have the potential to prescribe larger amounts of our product.
The question then becomes which of the A & B customers to target further. Setting budget and resources aside (they are most certainly critical), this will depend primarily on two elements: your strategy for the brand and the stage of your brand’s lifecycle. An offensive strategy geared to gaining market share will focus on your A2’s and possibly A3’s (depending on the length of time the product has been on the market) as a priority with remaining resources assigned to maintaining A1 and B1 usage. Similarly, in the early stages of a product lifecycle, there will be very few A1’s and A2’s, simply because nobody has really had enough time to convert fully across to your product. Your focus will then be on the A3’s with the aim of moving them across to be A1’s as the product spends more time on the market and they gain experience with the drug.
Train to Profile, Segment & Target in the Pharma Industry
A final word though, whilst the concepts are easy to explain verbally to our course participants, we find that the real behaviour change comes when they are actually required to undertake a segmentation and targeting exercise. In the real world, this would be too risky but through our Simpact business simulation platform, our course participants are able to practice their segmentation skills without running the risk of crippling an entire sales organisation.
By using our bespoke business simulations, our course participants use the information provided to them to profile, segment and target their virtual customers, allowing them to see the effects of their decisions on their virtual brand’s revenues and costs. This makes for an extremely effective learning tool that has received outstanding feedback from our course participants.
Conclusion
By carefully profiling your customer base and implementing an effective segmentation and targeting policy, you are able to free up resources, including budget, to focus your efforts more efficiently.
It is for this reason that profiling, segmentation and targeting forms a core area of not only our first line sales management course but also our brand management and launch excellence courses. By truly understanding how effective targeting can release budget and reduce your cost base, sales and marketing managers are able to deploy their resources far more efficiently.
The Actando Consulting Team


