When pharmaceutical marketers think about analysing the competitive environment within which they are operating, the focus tends to be on specific quantitative aspects such as market shares and market growth. Whilst a thorough understanding of these areas is critical, there is one technique that is often neglected or under-utilised: the patient flow model.
In this article, we’ll take a closer look at the patient flow model, how it is constructed and what key insights that we can glean from it. Finally, we’ll have a look at some of the key considerations when teaching the Patient Flow Model.
What is a Patient Flow Model?
Quite simply, a patient flow model is a quantitative tool that allows the marketer to analyse a market by deconstructing it using a combination of demographic data, disease incidence & prevalence and competitive market share information.
It can be used to size a new or existing market with regards to potential customers, to identify untargeted reservoirs of potential customers and as a highly flexible and logical forecasting tool.
What does it look like?
Before we start, one critical element in building a patient flow model is that you should never build it alone. There are a number of reasons for this but there are two that are particularly salient:
- Firstly, you will almost never have all of the information that you require available to you from a single source and shall therefore need to draw on the expertise contained within your cross-functional team.
- Secondly, many eyes are always better than one when critically assessing the accuracy and the logic of the completed model. It is very easy to miss out a step, add in a duplicate step or simply to get the mathematics wrong if you are working on your own.
At its most basic, the patient flow model looks like an organisational chart or a decision tree. In the figure below, you can see a very simple patient flow model for an imaginary disease and population.
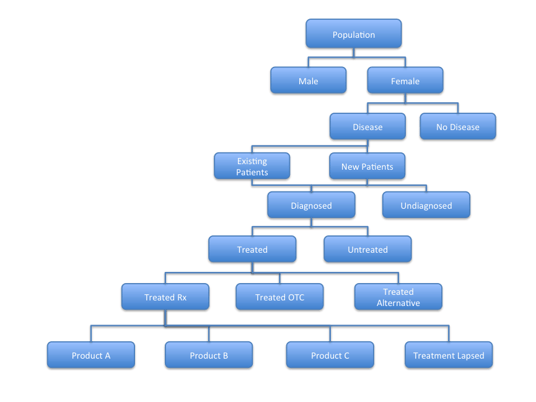
The analysis begins with the population of the country being investigated. This is then deconstructed according the factors relevant to the product or disease area, each step getting more and more granular until you arrive at individual product level.
What information should each cell contain?
Each cell should contain a minimum of four items of information:
- A cell title
- A percentage
- A value
- A source
The title should describe the contents of the cell accurately and concisely, usually in one or two words, in a format that is easily understood. The percentage is that of the value of the parent cell to the cell with which you are currently working whilst the value is the percentage multiplied by the value of the parent cell. Finally, every cell must have a reference for the information it contains. The quickest way to look like an idiot in front of a senior management team is to present a patient flow and then be unable to provide the references for the values and percentages on the screen.
Where can we find the required information?
Demographic statistics are usually the easiest information to find, as it is often freely available from government websites where census data are published. Other sources of information at this level may well include the likes of the CIA website, as well as local government, if appropriate.
Epidemiological data are usually more difficult to find for individual countries. Larger and more affluent countries often have local published data, clinical trial data or even registries that offer specific and accurate data. Many smaller countries do not have this level of country-specific information and so another plan needs to be made. The most logical is to use published data from a neighbouring country showing a similar profile to the country for which you are building the model.
So what do you do if even extrapolated data is not available to you? Well, the next two logical steps are to use your external experts to provide you with guidance; constituting an advisory board with a group of external experts may well provide you with the information that you require. Failing that, you may well need to conduct some primary research in order to gather the information.
Following this, please always be aware of the limitations of the data you are using – if you have extrapolated data from a neighbouring country, make sure that you clearly identify this in your model. Remember that extrapolated data are usually always better than guesswork but you must acknowledge its limitations.
How can we use the Patient Flow Model to identify opportunities?
By carefully assessing each stage of the patient flow model, we can start to identify and, importantly, quantify reservoirs of patients who represent an opportunity for our product. By quantifying of these opportunities, we can start to put a number to each, allowing us to begin the selection process.
Opportunity 1: Undiagnosed patients
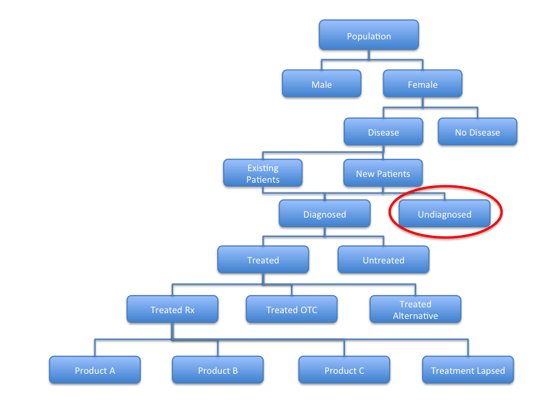
If the diagnosis rates are very low, this may represent a significant opportunity for our product. We may well want to put a disease awareness programme in place, either as a single company or in partnership with your competitors. By increasing diagnosis rates, more patients will require treatment and the resulting sales will benefit all products in the class.
Please remember though that the only time you should conduct a disease awareness campaign on your own as a single company is when you are the market leader, otherwise you will be driving patients into the waiting arms of your competitors.
Opportunity 2: Untreated Patients
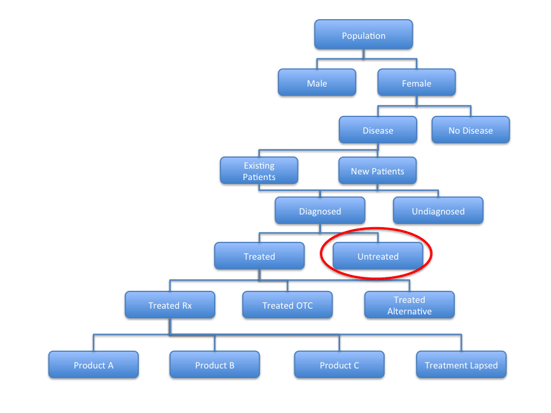
Before we begin, we need to be completely clear – there may be a very good reason why some patients remain untreated. It is therefore extremely important that you understand the reasons for the treat / don’t treat decision as it may well open up opportunities. It is equally important that you remember to respect the healthcare professional’s decision not to treat the patient with medication.
By critically assessing the reasons for not treating a group of patients, you may be able to tailor your messaging to speak to these needs and so increase treatment rates for the disease area.
Opportunity 3: Patients treated with OTC medication or alternative treatments
Your analysis may well uncover a group of patients who are treated with over-the-counter (OTC) medication or alternative therapy. Once again, you need to be asking why this is the case. Is it that patients receiving OTC medication are mild patients or patients who fall outside of the licences for the prescription drugs? Are the prescription therapies too expensive? Are people in this group simply not willing to take prescription medication?
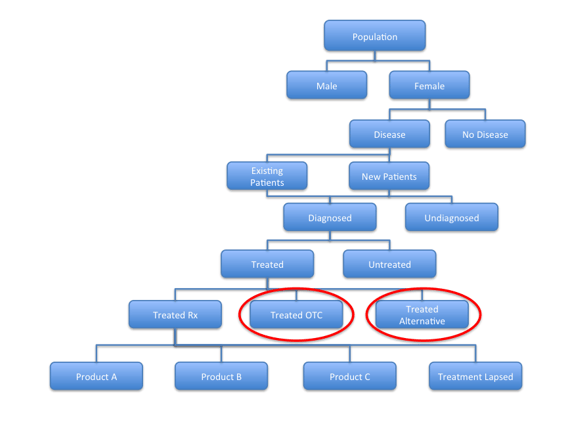
Once again, the challenge is to seek to understand the reasons for the healthcare professional’s choices at the treatment stage.
Opportunity 4: Competitive products
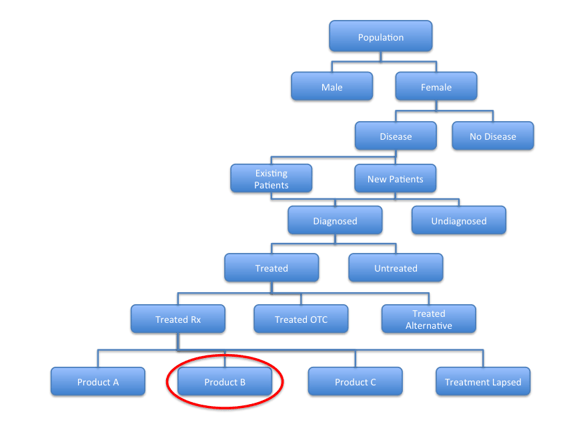
Competitor products often represent the main opportunity for a product. By assigning a numerical value to the number of patients on competitor products, you begin to quantify the opportunities present within the competitive space, ranking them as required.
Opportunity 5: Lapsed Patients
Patient adherence and compliance varies widely by disease area and medication type but the one thing that all healthcare professionals will agree on is that patients very seldom take their medication as directed over the treatment period. It costs the healthcare system an absolute fortune, in fact the Centres for Disease Control in the USA estimates the direct costs to be up to $280 billion annually.
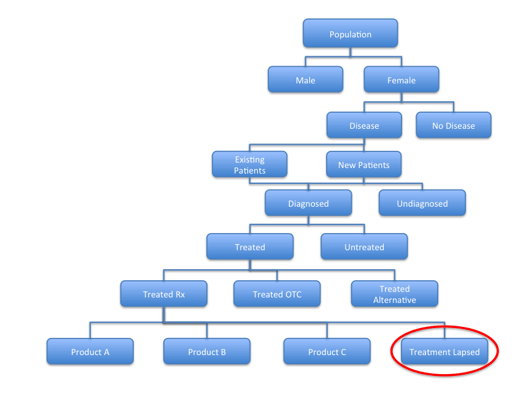
Patients who have allowed their treatment to lapse represent an opportunity for a switch to a new therapy, ideally yours, but they also represent a threat to your product as patients switch away. An adherence campaign may well be a worthwhile consideration for your product in this case, combined with messaging aimed at encouraging a switch to your product.
Teaching the Patient Flow Model
Let’s be quite clear right from the start – you cannot teach the Patient Flow Model in a theoretical environment and expect your course participants to absorb and retain the information and then transfer the knowledge into their day job.
The only way to teach this effectively (and efficiently) is through a blended learning programme that features some form of case study and simulation. In addition, the simulation must be complex and detailed enough to challenge the course participants to obtain and enter the correct information within a structured format.
All of the challenges that the brand team will face in real life should be incorporated as much as possible within the case study, allowing the teams to make mistakes within the safe training environment that might potentially negatively impact their strategy in the real world.
Being aware of these challenges shaped the way that we built our bespoke online training simulation, called Simpact. As the Patient Flow forms the first module in our Brand Management & Marketing Fundamentals Courses, it was essential that we built a highly detailed and challenging case study within the simulation and designed it to test our participants’ abilities.
We ensured that all of the potential errors were incorporated within the information provided in the case study, requiring the course delegates to carefully assess each piece of information before they entered it into the model. In addition, we made sure that there was information simply not available to the course participants, as would be the case in reality. This meant that participants would have to commission market research to obtain the information, balancing cost against the ramifications of incorrect information. The combination of the plenary sessions where the course participants are taken through the theory and the simulation-based practical sessions where delegates can put the theory into practice, really delivers exceptional training results.
When you are next looking at specialised marketing training for your pharmaceutical brand teams, first check to see whether the course you are considering combines theory with a detailed business simulation. If it doesn’t, you might want to contact Actando, where we have been delivering global blended learning programmes to the pharmaceutical industry since 2010.
If you would like any additional information on The Patient Flow Model or would like to see how Actando can help you to upskill your marketing team, please contact Alex Dauge at contact@actando.com.
The Actando Consulting Team


